
In my previous post, you saw a so-called Cumulative Flow Diagram (CFD) of Network Traders. It shows the number of tasks (features) that have been implemented over time. There is a lot of interesting stuff you can read out of it. So what is there to be found in my example, and why do I have one in the first place?
From my experience, there are two very distinct emotional phases at the beginning of each new game project. First, one of euphoria, when the first initial tests and prototypes are fun to play and your ideas look promising. Second, a sinking feeling of oppression when you realise what a mountain of work still looms ahead before anyone else would actually want to play your game.
Planning and Subdivision
But there are two approaches, well-known from efficiency techniques, you can apply to counteract this second stage: planning and subdivision. Planning means setting yourself regular and reachable goals, such as milestones or versions of your game. Subdivision means dividing up your workload into small parcels where each takes only a little time, but you get a regular sense of achievement. Exactly like the achievement systems in many video games (“Killed 1000 wolves” and such).
Even though I work mostly alone, I like to use JIRA to implement these techniques. It’s free for up to 10 users, so no great investment here. Atlassian moved their services into the cloud this year, which made it less responsive and reduced the feature set, but it’s still usable nonetheless.
First, I define a set of high-level features, such as important parts of the game loop, screens, player management, server connection or whatever I need. These so-called “epics” are prioritized and assigned to future milestones of the game. Each time I reach a new milestone, I assign those epics to new versions (two to five each) and define the versions in JIRA. Then I derive small packages (user stories) for each epic and get a set of manageable packages, up to 20 for each version. Now I have a work-load I can tackle with hopes of finishing it in two to six weeks. Each time a release a new version, it’s a new achievement I reached (another 1000 wolves killed).
Interpreting the Cumulative Flow Diagram
Below, you can see an updated version of the CFD for Network Traders. It exhibits a very distinct, step-like pattern. Each step represents a different version of the game. Before each step, there is a short increase in backlog items only. That’s when I broke down the epics into smaller chunks. And every now and then, a version is the final step of a milestone (MS).
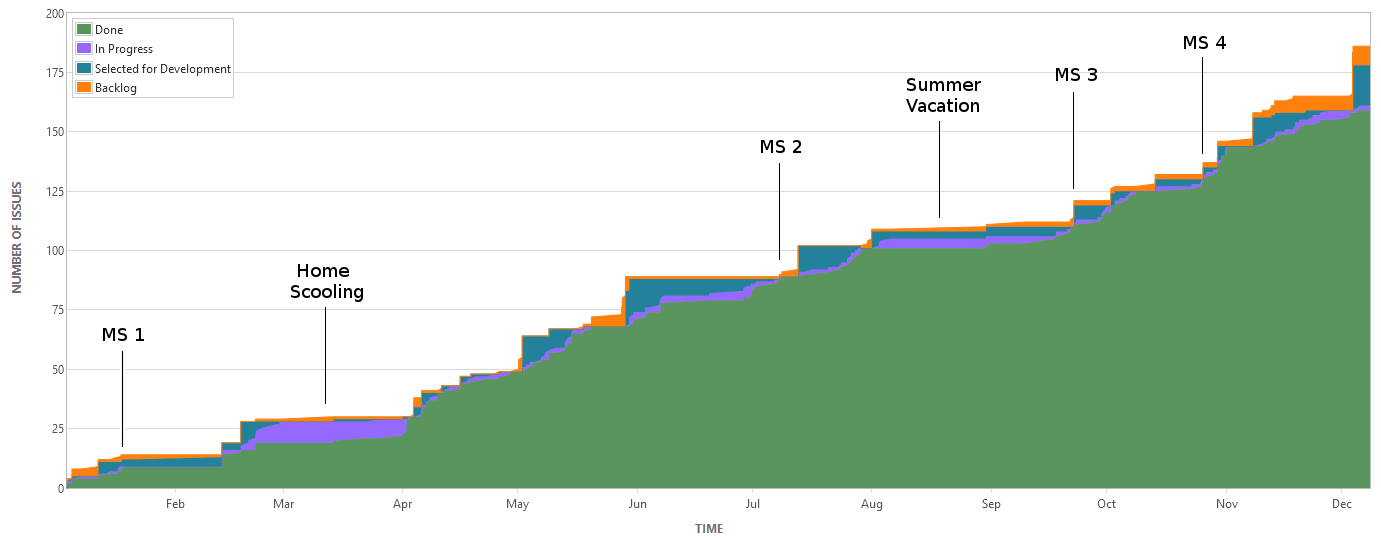
Apart from the step-like pattern, there were some external events which had an impact on the project and show up in the diagram. In March, e.g., we had an extensive period of home schooling. In addition to my day job, that left little room for spare time projects. And in summer, the whole family was home and recreation had priority.
How do you manage your hobby projects? Do you work in a similar fashion, or do you use additional techniques to motivate you? Please leave a comment!